COVID-19 CASES
In the final week of March, the MSP region had 271 average daily COVID-19 cases, a 7% increase in cases from the previous week. Cases in the Greater MSP region are at the lowest levels since summer of 2021, before the Omicron wave hit the U.S.
WHAT THE DATA IS TELLING US
Starting in February of 2022, average daily cases began to decline week-over-week in the MSP region as the region recovered from the peak in late 2021 and early this year, when average daily cases reached 7,600. Cases have continued to stabilize since. BA.2, a new strain of the Omicron variant, is now the dominant strain and is responsible for the majority of cases in the region and in the U.S. The new variant appears to be causing a slight increase in cases in the region now, but it’s too early to tell if the variant will cause a significant spike.
Average daily cases in the MSP region remained below 600 until early October 2020 before spiking over 4,000 the week ending November 20th and remaining higher than 3,000 throughout the end of November 2020. Average daily COVID-19 cases were higher in November and December 2020 than any other time of the COVID-19 pandemic. After several weeks of sustained declines in new cases, state restrictions were loosened to allow restaurants, bars, and entertainment venues to reopen in early January 2021 and again in mid-March 2021. In May 2021, nearly all state restrictions on businesses and in-person activities were revoked in Minnesota. The Omicron variant caused another significant spike in late 2021, and cases now appear to have stabilized from that. Consistent and significant decline in case levels paired with continued increasing vaccination rates has led to progress toward meaningful economic recovery, however, some uncertainty remains due to new variants of the virus.
 |
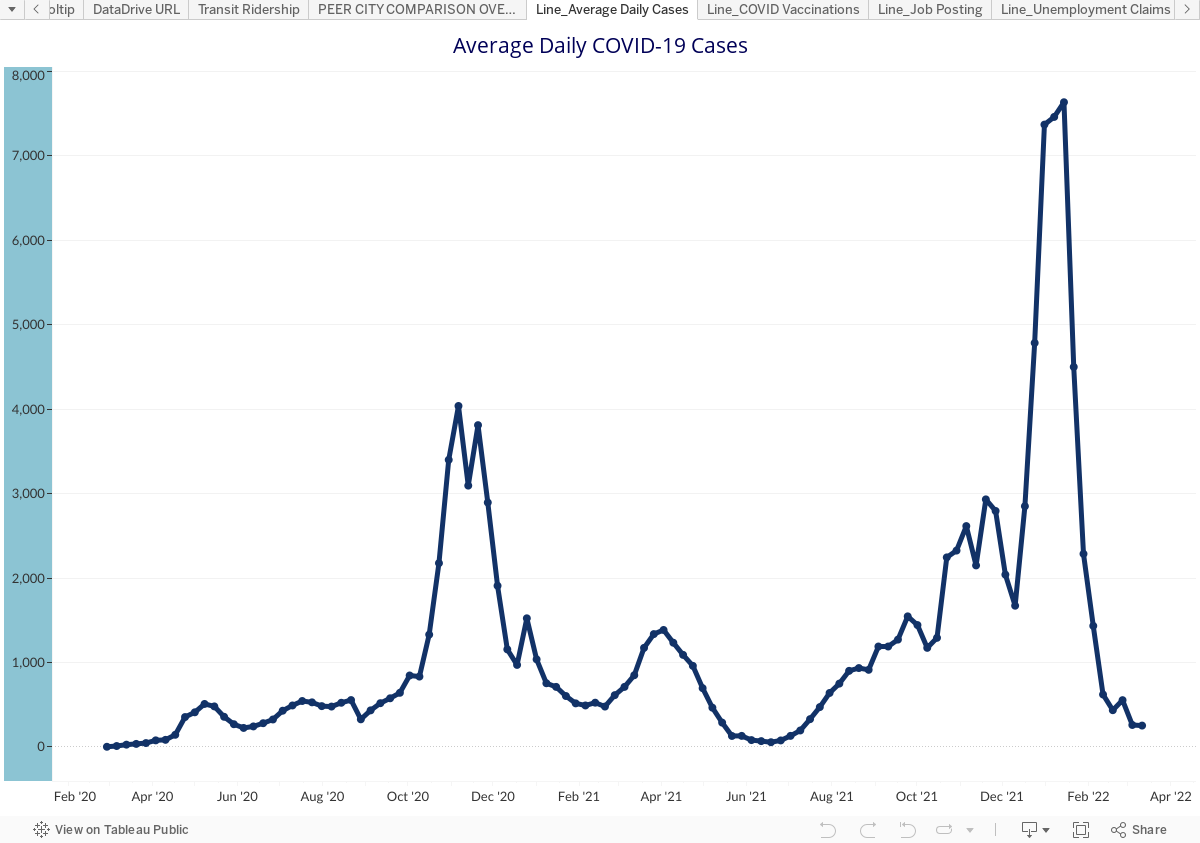 |
This metric tracks average daily new COVID-19 cases (confirmed and probable) reported for the specified week in the 15-county Minneapolis Saint Paul metro region. Data is updated weekly and extracted by GREATER MSP from the New York Times.
WHY THIS MATTERS TO ECONOMIC RECOVERY:
The COVID-19 pandemic dramatically disrupted the economy at all scales, fueling an economic recession in the U.S. The first case of COVID-19 was reported in the U.S. in January 2020 with the first case reported in Minnesota in March. With intent to slow the spread of the virus, the state of Minnesota enacted a series of executive orders beginning in late March that limited interaction. While the virus itself is the culprit for significant disruption to healthcare systems, it is the control measures enacted to slow the spread of the virus that most severely crippled the regional and national economy. State stay-at-home orders led businesses that were able to shift workers to operate remotely, but many businesses deemed non-essential were forced to temporarily close and furlough or layoff employees. While many business functions have been able to adapt and survive, it is expected that the economy as we know it has been altered with the longest standing impact expected to be felt by low-income service workers. As the number of new COVID-19 cases drop and stabilize, and vaccinations have become widespread, we can now begin to observe early signs of improvements toward economic recovery, though progress has slowed in late summer as the Delta variant has caused another case spike. The Recovery Hub is tracking these indicators where they are available in real time, but many will not be able to be fully observed until official federal data is released from the Census Bureau and the Bureau of Labor Statistics.
RACIAL EQUITY AND INCLUSIVE RECOVERY:
The COVID-19 pandemic has disproportionately impacted low income and BIPOC communities across the country and in the Minneapolis Saint Paul region. According to American Public Media’s Research Lab, Indigenous, Black & Pacific Islander Americans have experienced the highest death tolls from COVID-19, and new cases per capita continue to be highest amongst black Minnesotans. Further, a 2020 analysis by GREATER MSP showed that 40% of BIPOC workers in the region were employed in retail trade, accommodation/food service, and healthcare. These industries have a very high concentration of jobs with high contact-intensity, where the risk of contracting the virus is much higher than those jobs that have less contact-intensity and/or are able to be performed remotely. These challenges faced by BIPOC workers amplify long-standing structural racial disparities in the MSP region.
TELLING THE FULL STORY:
The spread of COVID-19 was particularly gut wrenching for the healthcare community in the region and state. With case volumes rising dramatically in November 2020, health care workers were becoming sick or exposed in the community at increasingly high levels and many couldn’t stay on the job. Hospitals had open beds but staffing shortages meant they can’t be used. Some hospitals reported that they have to turn new patients away. Hospitalizations and intensive care unit admissions were reaching their capacities. Statewide deaths were the highest they have been since the start of the pandemic. We cannot lose sight of the individual emotional toll of this crisis on the frontline workers and the families that tragically lost loved ones to the virus.
HOW WE STACK UP:
COVID-19 infection rates have varied significantly across states and regions in the United States from week to week. To understand the relative intensity of COVID-19, we are comparing average daily cases per 100,000 residents on a weekly basis for the MSP region’s peers, a set of regions selected based on demographic and economic characteristics. The same peer regions are tracked in the Regional Indicators Dashboard, a set of indicators that track MSP’s long-term economic competitiveness.
In the final week of March, average daily COVID-19 cases per 100,000 residents decreased in about half of MSP’s peer regions. The largest increase in average daily cases from the previous week was Atlanta, up by more than 600% from the previous week. The largest decrease occurred in Austin, down to just 28 average daily cases in the latest week. MSP was in the middle of the peer set considering average daily cases per capita, with 7 cases per 100,000 residents for the third week in a row.
 |
HOW TO LEARN MORE:
The New York Times is tracking case counts by county and state, with a variety of case metrics, charts, and maps with easily digestible information on trends in COVID-19 infection rates throughout the pandemic.
The Minnesota Department of Health provides extensive data and daily updates on COVID-19 cases in Minnesota.
American Public Media’s Research Lab’s THE COLOR OF CORONAVIRUS is tracking COVID-19 deaths by race and ethnicity in the United States for all states, with detailed analysis of trends in mortality for each racial and ethnic group.
Want to share insights from the Regional Recovery Hub in your own presentations and materials? Download the Recovery Toolkit.